Daily Market Analysis and Forex News
USDInd slips ahead of critical US inflation data

- Bloomberg reports Trump’s team considering gradual tariffs
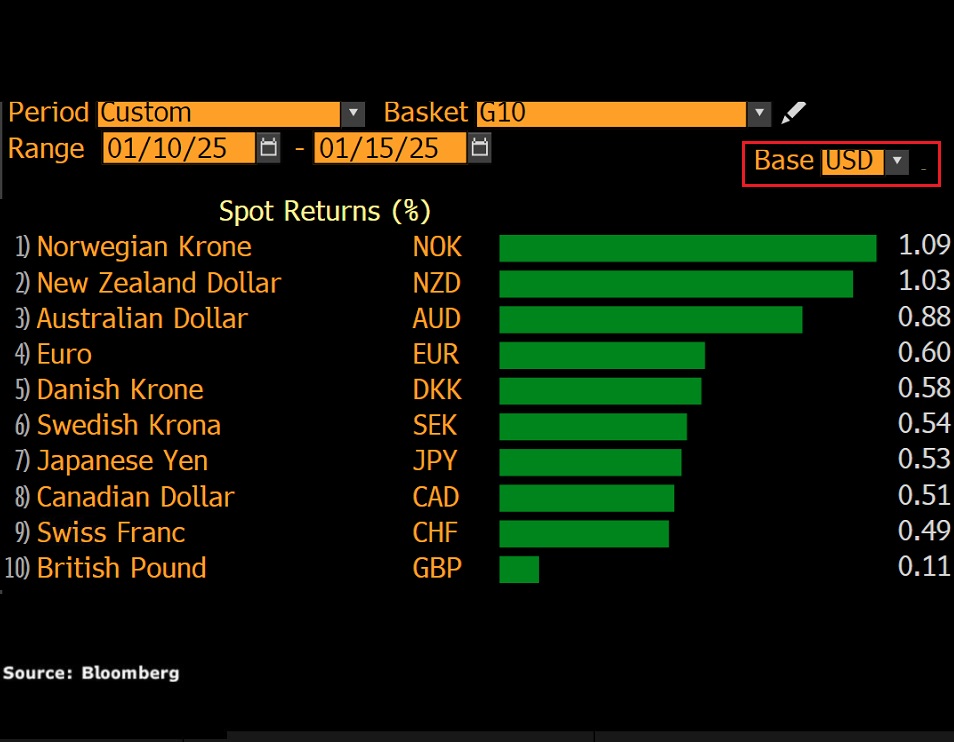
- USD ↓ against all G10 currencies this week
- US CPI report to shape Fed cut expectations
- Over past year, US CPI triggered ↑ 0.7% & ↓ 0.5%
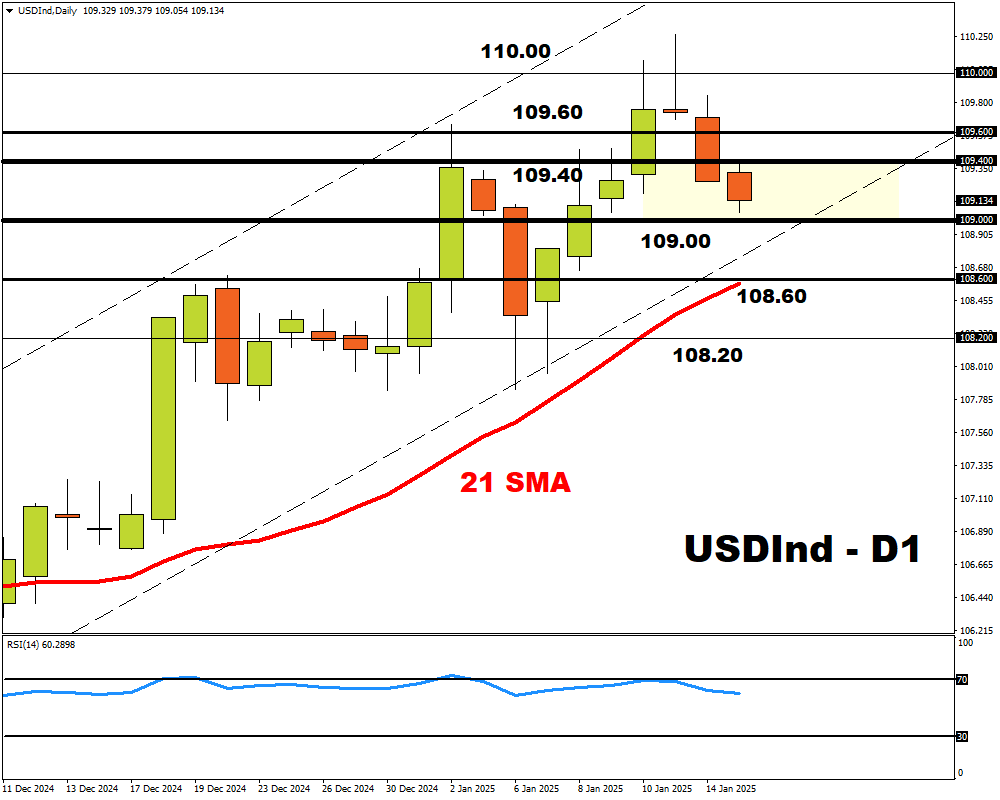
- Technical levels: 109.40 & 109.00
It’s been a rough week for the dollar thus far.
FXTM’s USDInd has shed 1% from Monday’s peak, while the USD is down against every G10 currency week-to-date.

Why is the dollar falling?
Fresh uncertainty around Trump’s tariff plans.
On Tuesday, Bloomberg News reported that Trump’s team was considering gradual tariff hikes.
Such gradual restrictions were seen cooling fears around rising inflation, allowing the Fed to cut rates.
This echoed a similar report by the Washington Post last week about Trump’s aides considering softer tariffs.
Note: Trump has yet to respond to Bloomberg’s claims through his Truth Social platform.
Any comments by Trump on this development could spark fresh volatility.
Speaking of volatility….
All eyes will be on the incoming US CPI report this afternoon.
Markets expect US inflation to remain sticky, supporting the argument for a pause in Fed rate cuts.
After last Friday’s solid jobs report, traders are now only pricing in a Fed cut by September 2025. The odds of a second cut by the end of 2025 are around 30%.
Further evidence of still sticky inflation could spark discussion around no rate cuts in 2025 - boosting the USD as a result.
Over the past year, the US CPI report has triggered upside moves of as much as 0.7% or declines of 0.5% in a 6-hour window post-release.
- A softer-than-expected US CPI report could send the USDInd lower as Fed cut bets jump.
- Should the inflation report print above market forecasts, this could boost the USDInd.
Technical outlook…
The USDInd is under pressure on the daily charts with prices approaching 109.00. The Relative Strength Index (RSI) has recently moved away from overbought territory, in line with the recent selloff.
- A strong breakdown and daily close below 109.00 may open a path toward the 21-day SMA at 108.50 and 108.20.
- Should prices push back above 109.40, this may open the doors towards 109.60 and 110.0.

By the way…
As highlighted earlier, the incoming CPI report could trigger significant price swings across global financial markets.
Over the past 12 months, this is how the US CPI has impacted these assets in the 6 hours post release:
- Bitcoin: ↑ 3.4% or ↓ 2.3%
- NAS100: ↑ 1.3% or ↓ 0.7%
- US500: ↑ 0.7% or ↓ 0.6%
- XAUUSD: ↑ 1.1% or ↓ 1.0%
Ready to trade with real money?
Open accountChoose your account
Start trading with a leading broker that gives you more.